By Jim Parks
Recently, my wife and I caught the movie “Moneyball” on TV. For those not familiar with the movie, it is based on the Oakland A’s 2002 season where statistical analysis, referred to as sabermetrics, was used to pick players for the team. Their main focus was the players’ ability to get on base by walk or hit, it didn’t matter. This went against the traditional methods of evaluating players’ ability such as gut instinct, perceived historical insight, and even how ugly were the players’ girlfriends. As the main character, played by Brad Pitt, sat around the war room, his statistician spit out various player numbers and percentages, much to the chagrin of the “old school” scouts and their methods. To quote Brad Pitt, “If he’s a good hitter, why doesn’t he hit good?” That scene brought to mind the process I have been using since 1989 to determine which fly to use and where to go fishing. Brad was being looked at like he’d lost his mind, but the results showed differently. It had been a few years since I last saw the movie and I had forgotten how good it was. I won’t ruin the end of “Moneyball”, but it’s well worth a watch on a cold winter night. But it did make me think, “If the fly is good for catching a lot of fish, does it catch a lot of fish?”
 A common tool I have observed over the years to help anglers is the hatch chart. For the newbies, a hatch chart is intended to identify specific insects using their scientific name, in Latin of course, with recommended fly patterns to “match the hatch”. They also show when certain, specific insects are typically present or hatching on a particular body of water. From my experience, hatch charts tend to work best for dry fly anglers, but can also work for nymph anglers by identifying the color of emerging insects, aka emergers, nymphs, and stoneflies. Hatch charts can be readily found online or at most fly shops located adjacent to the numerous rows of flies for sale. For those unfamiliar with a particular stream or lake, a hatch chart can be a great starting point on what to tie at the vice beforehand and to use on your first cast. I remember using a hatch chart on Flat Creek, just outside of Jackson Hole, Wyoming fifteen or so years ago. While many hatch charts are specific by month, the Flat Creek chart was down to the hour!
Having been raised in the mountains of East Tennessee at the edge of the Great Smoky Mountains National Park among mentors who were strictly nymph anglers, I was cut from a different piece of cloth from what is considered typical in many areas. It is due to my “raisin” that to this day I still predominantly fish nymphs. My takeaway from hatch charts, even the hourly version on Flat Creek, at most, is to see what other fly anglers use and what stoneflies or nymphs are on the move. On Flat Creek, while others struggled following the chart, as did I for a few hours, I went against the norm by using a highly effective wooly-booger! That day was another example of my proclivity in “Wading Against the Current” (Oct 2021 The Angler Magazine) where I tend to fish a different path from the status quo. Continuing further down that path, albeit a long one, over the years I developed my personal Fish Chart. As earlier mentioned, whereas a hatch chart shows the fly needed to match the hatch, the fish chart focuses first and foremost on the where, when, and what fly pattern to use that will catch the most fish using the information and results of previous trips. Maybe I should coin the term fishmetrics? Creating and fine-tuning my fish chart has greatly simplified my fishing decision process by taking nearly all of the guesswork out of what fly I will use. Additionally, on those cold winter days fit for nothing but time at the vise, I use the fish chart to focus my attention in stocking up on the most productive patterns for the upcoming trips.
The idea of the fish chart came to me following a Groundhog Day 1989 trip on a medium sized, freestone stream with minimal hatches. On such streams, attractor patters are often the way to go. That day, I decided to begin keeping track of information with the goal of knowing the best fly to use, as well as the best location to fish based on my documented experiences of how I prefer to fly fish to catch the most fish.
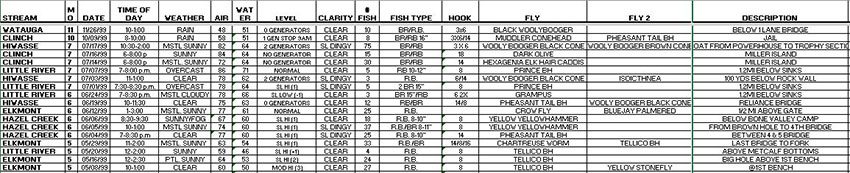
As the sabermetrics used in “Moneyball” was to get runners on base thus resulting in wins, I use fishmetrics to show the right fly to use to catch the most fish. Here’s what I did and how it works. By gathering information consisting of observations made during each trip, I enter that information in a spreadsheet, currently Microsoft Excel. I also keep the latest version on my smart phone for on stream use. Over the past thirty-two years, I have narrowed down the information I enter to the following; stream name, month # (march =3), date in month/day/year, time of day when the fish were biting best (10:30-13:00), skies in varying degrees (sunny/overcast/rain), air temp, water temp, water level (low, average, high) or generation if a tailwater, water clarity (dingy to clear), # fish caught, type (RB,BR,BK), Fly 1, Fly 2, Fly 3 (in order of what worked best), description of location (1/2 mi above camp X), and any notes such as fish size. Any entry highlighted in RED designates a trophy fish was caught that day. Initially, I included moon phase and actually found first quarter moon being the most productive. However, I no longer include the moon phase as it has no bearing on where I would choose to go as the same moon phase exists for all locations. Also, if I ever change my mind, I can go back and add this information later. I record information that I believe will provide me with a very educated guess for the best location to fish when considering my next trip, be it a small mountain stream, river, or tailwater. Obviously, over the past 32 years this information has grown. If used properly, which also takes some experience, it allows me to pinpoint my next trip plan in finer detail. My fish chart has done so well in fact that some of my fellow anglers have jokingly accused me of cheating! Still, they do call occasionally to tap into my fish chart, which I’ll admit to “keeping close to the vest”.
 Here’s an example of how I use it. Suppose I want to fish a small stream and it is July, with a recent dry, heat wave, meaning the water will be warm and low. I would sort my information by “7” for July, water temp (high to low), low water level, and finally # of fish caught from high to low. Then, I look at what flies have worked best. Say it’s stream X below a particular waterfall, and Fly #1 is a #14 bead head pheasant tail and Fly #2 is a Greenie Weenie. While on the stream, a typical summer storm hits where I’m fishing on stream X and the water begins to rise and get dingy. I look up my fish chart and change the water to high and dingy. It tells me the best fly is something heavy like Jim’s Grampus as the #1 fly, an olive wooly-booger as #2 fly, and a yellow stonefly is #3. I have 2 options, depending on if the water looks better for a tandem nymph rig where I would tie on flies #1 & #3, or better to strip a streamer in which case I’m using the olive wooly-booger (fly #2).
It would seem easy to get “information overload” or bogged down in “paralysis by analysis”, but as more information is added, and the experience is gained in how to apply that knowledge, I find fewer variations over time as it seems the “cream rises to the top” in the best flies to use with conditions to maximize the number of trout I catch. An interesting find has been that some of the most productive patterns are the same as when I first began tracking my trips even though I’ve tried and fished with 100’s of patterns over these past 32 years. I’ve concluded that for the most part, trout eat today what they did 30 or 40 years ago. Of course, some new fly pattens and synthetic tying materials have emerged, the use and effectiveness of which will be reflected within the program if they produce.
In putting the information to actual use on the water, when I nymph fish, I nearly always use a tandem rig of two flies, both of which will be the best two nymph patterns as recommended by the fish chart. After a short period of time, if one fly is outperforming the other, I will place the best fly on top and drop off a lesser-recommended fly or try a new pattern. Doing so provides me with an excellent comparison as I can leave the working fly on while periodically changing the lower fly. I keep the most effective fly on top as changing the bottom fly requires less knot-tying for each change.
In explaining this process to other anglers, I often hear, “That takes a lot of time!” Considering that reply, I realize I can go on a trip and with a few minutes of observation and reflection on the day’s fishing, have all of the information I need for my next, quick entry. Over the past three decades, collecting the information has taken considerable accumulated time, but typically no more than a few minutes when I get home and document what I’ve observed during the process of putting up my equipment for my next trip. The payback has been well worth the effort! As stated earlier, I can be sure to have the flies I know I’ll need, and while many anglers may be changing flies to find what is working, I have a HUGE leap in starting out with the flies that history has shown to be the most productive. Quite often, I finish with the same flies I started the day, even after changing patterns to determine if something works better. I call that “keeping the fish chart honest!” And speaking of honesty, fishermen are known to “exaggerate” their catch in both size and number. Doing so is NOT a good idea as entering false information will render the chart less effective going forward. As they say in the tech information world, “garbage in, garbage out”, and nobody wants to rely on bad information.
Jim Parks is author of “Tails of the Smokies”